January 15, 2026
Property Market Stress Dashboard Update
I have made some updates to the Property Market Stress Dashboard. The changes are largely visual but offer more clarity than before. It's opinionated but thats the nature of this type of view.
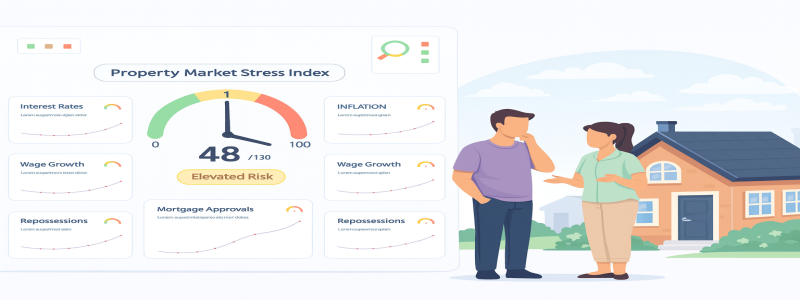
The market stress dashboard is the most opinionated part of the site. All the data used is verifiable and provided by various government departments. Where it becomes opinionated is how I calculate the stress level and how each is represented.
The dashboard is over here.

Recap on elements used in the property market stress dashboard
There are currently eight measures that are rated individually for stress, and all are combined to create the index.
- Interest rates - Simple one, published at the end of every Monetary Policy Committee meeting.
- Inflation - Published monthly, the site uses the CPIH, which includes housing costs.
- Wage Growth - Important, if wages track above inflation, great; if not, it could cause an issue for borrowers.
- Unemployment - Rising unemployment leads to higher arrears and repossession.
- Repossessions - Rising repossession is a negative market indicator.
- Arrears - Rising arrears are a negative market indicator.
- Mortgage Approvals - Higher approvals indicate positive market activity.
- House Price Index - Any growth is positive, persistent falls signal stress.
On wage growth, I compare this with inflation, but not directly. For example, wage growth could decrease, and inflation could increase, but wage growth stays green. The reason for this is that as long as wage growth remains higher than inflation, all is good. On the wage growth panel, it does indicate whether the 'real' change is positive or negative.
So, those are the 8 indicators I use. There could be others, but these are direct indicators that have the most signals (in my view) to suggest market stress.
Recap on the method used to calculate the property market stress level
The approach used is the same across all indicators. The release of data for most indicators is monthly or quarterly; there are some quirks, but the dashboard is updated immediately upon the release of updated information. I have alerts to ensure I know when something changes or is updated.
Each panel is ranked by the length of the current “bad” streak (the number of consecutive periods the indicator has moved in the direction that historically signals stress). The direction differs by indicator (e.g. higher interest rates and unemployment are worse, while lower approvals and HPI are worse).
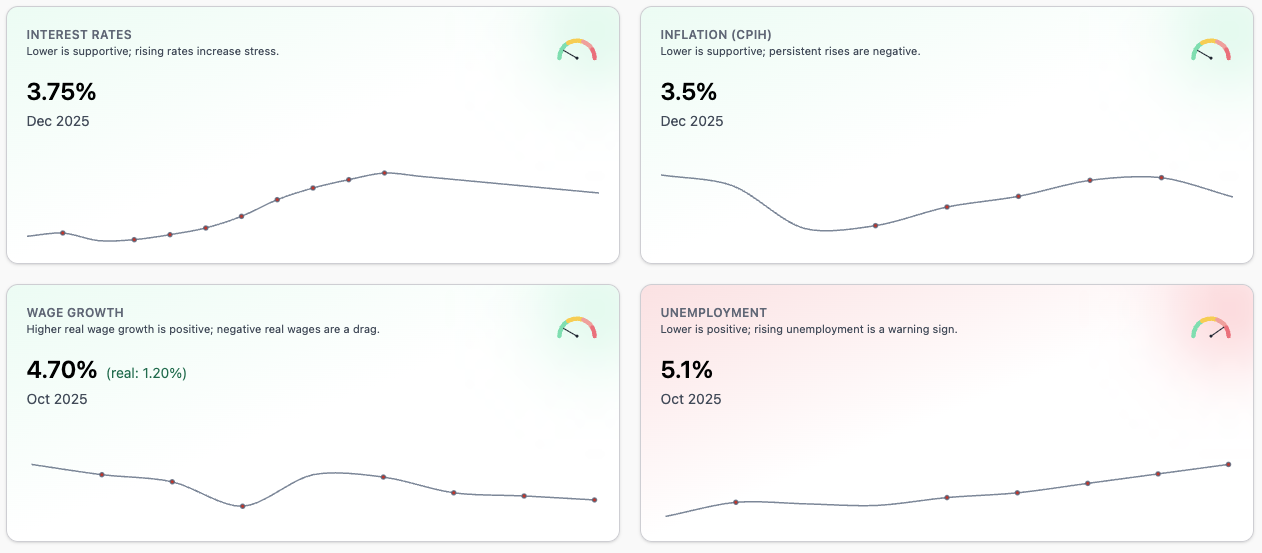
- Green — no current bad streak; conditions broadly supportive or normal.
- Amber — 1 bad period; early warning sign, possibly.
- Red — 2/3 consecutive bad periods; sustained stress signals.
- Dark Red — 4+ consecutive bad periods; elevated risk of downturn.
The Property Market Stress Index combines all eight indicators into a 0–100 score. Roughly: 70–100 = high stress, 40–69 = elevated risk, below 40 = low stress.
Summary
As noted, most of the changes are visual. Now, the main panel shows the overall stress rate. Each indicator panel now clearly show the level of stress based on the method used. Hopefully, this makes it far easier to understand than before.
Again, it's very opinionated. Always happy to hear feedback, suggested changes or other indicators that would add benefit.

Comments (0)
Want to comment on this page? Login or Register.